 SCORE 94
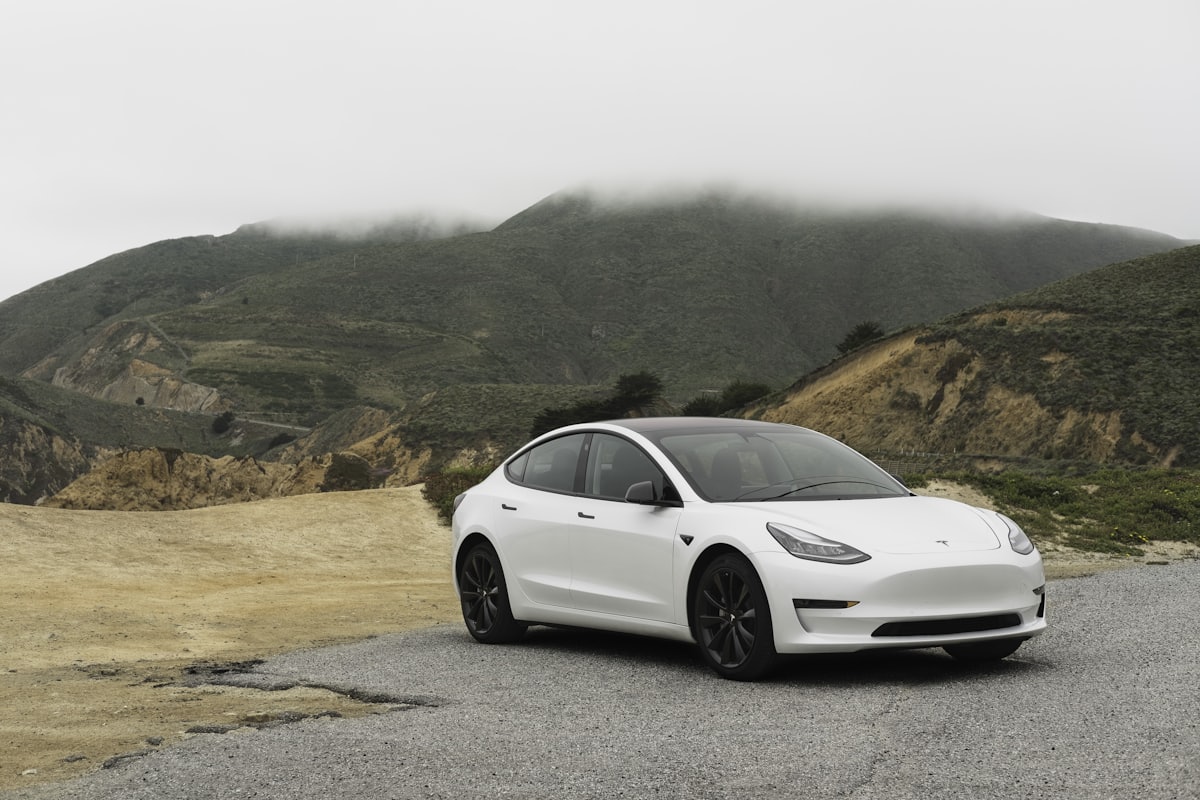
Tesla Model 3
Los Angeles, CA
$1,840/mo
DATA FOR SMARTER TURO HOSTS
Know which cars make money on Turo — and where. Live marketplace intelligence for serious hosts.
FRESH RANKINGS, EVERY WEEK
SCORE 94Los Angeles, CA
$1,840/mo
 SCORE 92
Miami, FL
$2,120/mo
 SCORE 89
Phoenix, AZ
$1,540/mo
WHY HOSTS SWITCH
See which models perform best in each market.
Visualize opportunities by neighborhood.
Run the numbers before you buy.
Get notified when markets become oversupplied.
WHY HOSTS USE FLEET INSIGHT
From market research to model selection, Fleet Insight gives you the data and tools to make confident, profitable decisions.
Start free trial →SCORE 94See which makes and models earn the most in your market.
Spot high-demand areas and seasonal trends.
Estimate revenue, costs, and ROI before you buy.
See how saturated markets are in real time.
Get notified about new opportunities.
Keep an eye on your favorite markets and cars.
POWERFUL MARKET INTELLIGENCE
Explore live Turo market data, compare vehicles, and find the best opportunities in seconds. Everything you need to make smarter decisions — in one place.
Overview
Car Rankings
Market Map
Earnings Calculator
Saved Cars
Market Alerts
Market Demand Map
Los Angeles, CA
Top Performing Cars
Los Angeles, CA
| Name | Revenue | Util. | Score |
|---|---|---|---|
| Tesla Model 3 | $3,421 | 72% | 92 |
| Tesla Model Y | $3,012 | 68% | 88 |
| BMW 3 Series | $2,891 | 65% | 85 |
| Audi Q5 | $2,764 | 62% | 83 |
| Mercedes C-Class | $2,521 | 60% | 80 |
View all cars →
Market Trends
Nightly Rate Range
$78 – $142
+12% vs. last year
Market Overview
38,421
Active listings · +6% MoM
72%
Avg. utilization · +4% MoM
$2,890
Avg. monthly revenue · +11% MoM
HOW IT WORKS
Search any city to see demand, pricing, and top performing cars.
Compare models, check competition, and run the numbers.
Buy (or list) with confidence and start earning more.
MARKET INSIGHTS
Our data helps you find high-potential markets, understand seasonal trends, and stay ahead of competition.
Highest Demand Markets
View all markets →
Seasonal Trends
+42%Los Angeles, CA
Peak demand in summer
Earnings can be 42% higher in Jun – Aug.
Market Competition
Los Angeles, CA
Moderate competition
A healthy market with room to grow.
Utilization Rate
Top Vehicle Categories
A PEEK INSIDE THE DATA
A peek at the data members use to decide what to buy and where to list it.
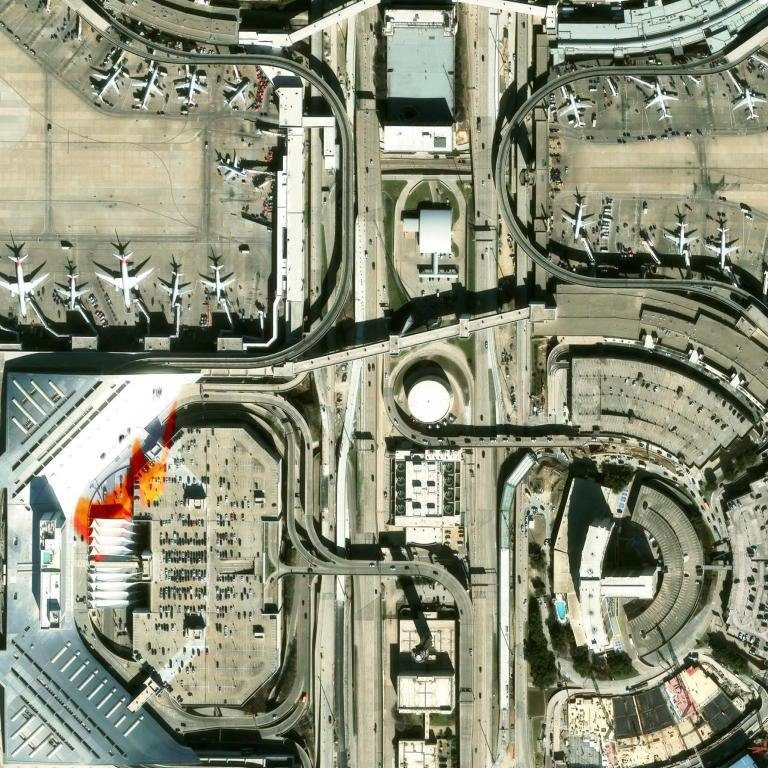
Los Angeles · trailing 90 days
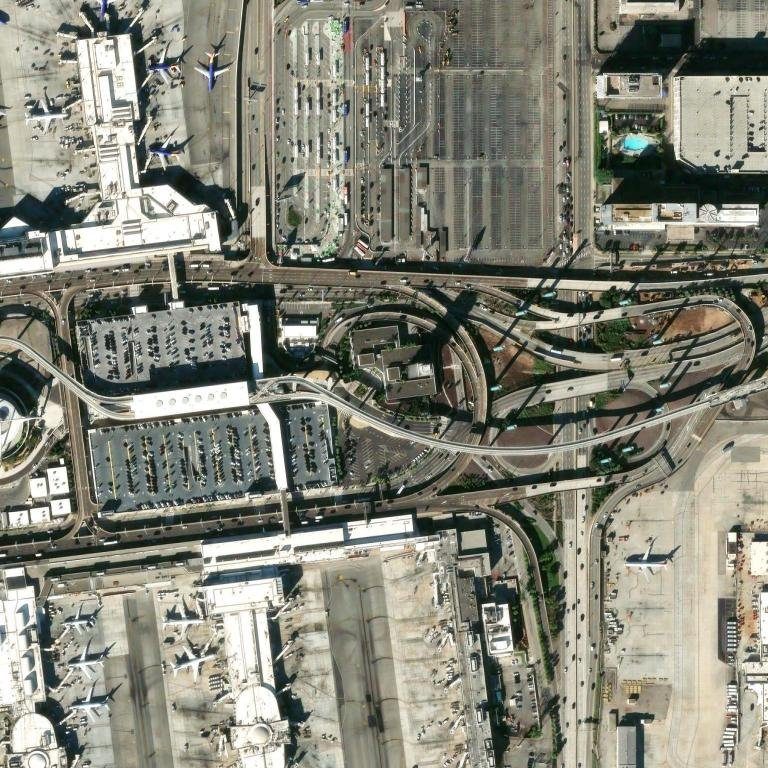
Live zipcode heatmaps · a new hotspot fades in every 3 seconds
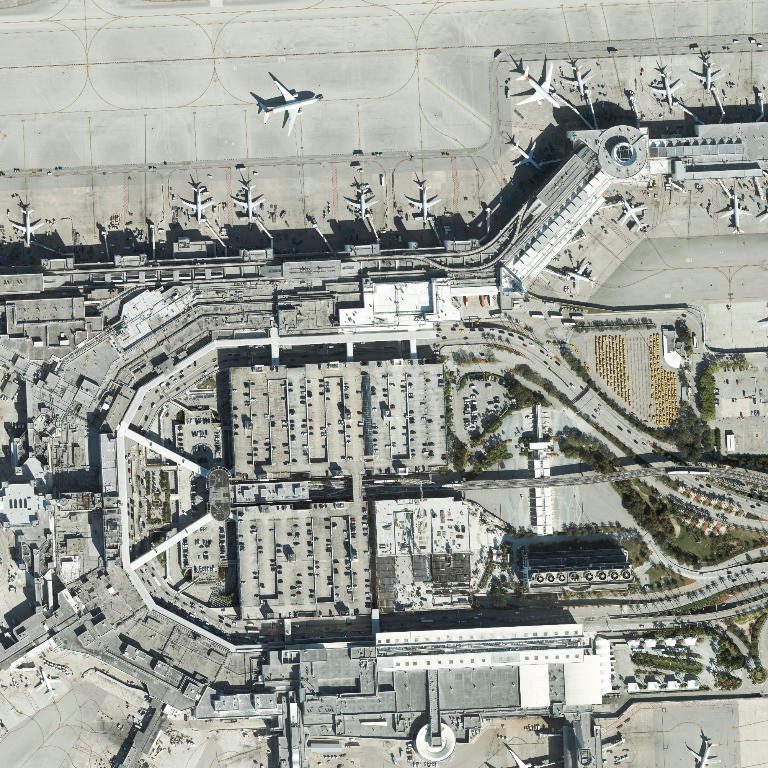
LAX Airport
avg demand 87
Terminal & rental-car footprints
Imagery © Esri, Maxar, Earthstar Geographics
FREE INSTANT ANALYSIS
Pick a car and a ZIP code for an instant profitability analysis — revenue, utilization, and margin.
THE COSTLY MISTAKES
 01
01That convertible feels fun — until it sits unbooked 18 days a month while a boring hybrid next door earns double.
 02
02If everyone on your block lists a Model Y, rates collapse. You need demand data, not driveway envy.
03$20 too low every night is $7,000 a year left on the table. Per car.
EVERYTHING IN ONE PLACE
Monthly revenue, utilization, and margin estimates for 2,400+ make-model-market combos — refreshed weekly.
Discover which neighborhoods and airport zones have more renter demand than competing cars can serve.
Plug in purchase price, financing, and insurance to see payback period and first-year profit per car.
Know which months spike in your market so you time acquisitions — and price surges — correctly.
Stop underpricing. See the rate range top hosts charge for your car in your market, by season.
Get warned when too many hosts list your model nearby, before your utilization drops.

From daily drivers to exotics — every class, ranked by profit.
TRUSTED BY TURO HOSTS
★★★★★ 4.9/5
From 1,100+ Turo hosts
“I was about to buy a Mustang convertible. Fleet Insight showed me a RAV4 Hybrid in my zip earns 2.1x more per month. That one screen paid for a decade of subscription.”
 Marcus T.6 cars · Phoenix, AZ2.1xmore revenue
“The area map moved my whole fleet near the airport zone I was ignoring. Utilization went from 61% to 84% in two months.”
 Priya S.11 cars · Dallas, TX61% → 84%utilization
“As a first-time host I had no idea what to buy. I copied the #1 ranked car for Tampa, listed it, and it booked 26 days in its first month.”
 Dan K.2 cars · Tampa, FL26 daysbooked, first month
SIMPLE PRICING
GOOD QUESTIONS
We continuously track public Turo marketplace listings — prices, trip counts, ratings, and availability — across major US markets, then model revenue and costs per make, model, and area.
Yes — that's the best time to use it. The rankings tell you which car to buy for your market before you spend a dollar, plus the nightly rate to list it at.
Rate optimization bands, saturation alerts, and expansion guidance: which car to add next and which underperformers to sell or relocate.
One plan: $78/month, or $600 for the year ($50/mo) if you pre-pay. 7-day free trial included — one better pricing decision on a single car typically covers years of subscription.
Yes. Monthly billing, no contracts, one click to cancel — and you keep every report you've already pulled.
READY TO FIND YOUR NEXT OPPORTUNITY?
Join thousands of Turo hosts using real data to grow their income.
More data.
More freedom.